If you want to keep your customers happy and your business growing, knowing your Net Promoter Score (NPS) is one of the quickest and best ways to get feedback. We’ve made updates across SurveyMonkey to make it simple to measure your NPS. Now you can create your Net Promoter survey, calculate your score, and get context for your results—all in one place.
Why Net Promoter Scores are important
Net Promoter Scores are calculated by looking at your customers’ responses to a relatively simple survey question: “How likely is it that you would recommend this company to a friend or colleague?” If your customers give you high marks, research by Bain & Company shows that you’re twice as likely to have long-term, profitable growth. Bottom line, you put yourself in good company when you calculate (and work to improve) your NPS.
Here are all the improvements we’ve made to give you everything you need to make measuring your NPS a snap:
New question type
Net Promoter Score is now a question type that can be selected when you create your survey. When you’re in Design, just click to add it to your survey. You can use the question as is, or add your company or product name to make it more customized.

You can also create a Net Promoter survey by choosing the Net Promoter Score Template.
Calculating NPS Scores
Net promoter scores are calculated by counting up the number of Promoters (people who answered 9 or 10), subtracting the number of Detractors (people who answered 0 through 6), then dividing by the number of respondents.
Sound a little complex? Don’t worry—we’ll do the calculation for you.
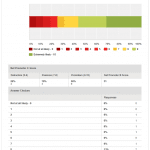
When you get results from your Net Promoter survey, go to the Analyze section and you’ll see a gauge that shows your overall Net Promoter Score. You’ll also see a data table with the number (and percentage) of Detractors, Passives, and Promoters among your respondents, so you can see the detail surrounding how your NPS was calculated.

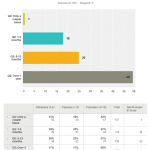
If you prefer, you can view a “distribution” chart of your results, showing your responses broken out by Detractors, Passives, and Promoters. All you have to do is follow a prompt to customize your chart, then choose a “Distribution Chart” to see this view:

If you want to understand distribution with more granularity–for example, to see how low a rating your Detractors gave you—you can even set up a “Detailed Distribution” in the Depth menu. The result is a bar chart that shows the number of responses for every answer option:

If you didn’t use one of our survey templates that ask the NPS question or pull the question directly from our question bank, you can calculate your score with our NPS calculator. You’ll just need the number of Detractors, Passives, and Promoters you collected from your survey.
Advanced Analysis with NPS data
In addition, you can use all the other powerful analysis tools on SurveyMonkey to dive deeper into your NPS data.
See what makes your customers tick by looking at how responses to other questions in your survey affect your NPS results. For example, if you ask how long customers have used your product, you’ll be able to see the different NPS scores for each answer choice. Just create a COMPARE rule to see how longer-tenured customers feel about you:

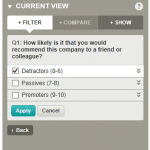
Similarly, you can use filters to look at how your Detractors or your Promoters answered your other questions. It’s easy to set up these filters in the FILTER BY Q&A section next to your results.

See how your scores change
A lot of companies run continuous NPS surveys that are always collecting data from their customers. Others calculate NPS scores monthly or quarterly. SurveyMonkey has made it easier than ever to track your progress. In Analyze, you can use our Data Trends feature to see how your NPS is changing over time:

In case you need any more inspiration, we’ve also calculated NPS benchmark data to help you see how you compare your score to other businesses. So, what are you waiting for?
Net Promoter® Score is a trademark of Bain & Company, Fred Reicheld, and Satmetrics Systems, Inc.


