Rating scales for surveys: definitions, examples, and differences
Choose the right rating scale for your survey. Learn about worded and numbered rating scales and their uses for accurate data collection.

Rating scales offer survey respondents flexibility, providing a fast method of giving feedback without burdening customers. But, knowing which rating scale to use for certain questions is vital for their success.
In this article, we’ll explore survey rating scales, question types, and tips for using them effectively.
What are survey rating scales?
A survey rating scale is a typical response format to a close-ended, multiple-choice question. Respondents will select from a series of options to express how they feel or what they think in response to a close-ended question.
There are several survey questions that use rating scales:
- Expressing the extent to which a respondent agrees with a statement.
- Relating how easy it is to complete or achieve a certain action.
- The degree to which a customer would recommend a product.
- The overall level of satisfaction with a service on a scale of 1-10.
Close-ended questions, like those that researchers use when exploring the topics above, all utilize survey rating scales.
Related reading: What is an interval scale and how to use it in your survey questions
What is an example of a rating scale?
Rating scales can come in all shapes and sizes. Some rating scales make use of words, others use numbers, and some even use symbols like stars or smiley faces.
Here are a couple of survey rating scale examples showing how to ask rating scale questions.
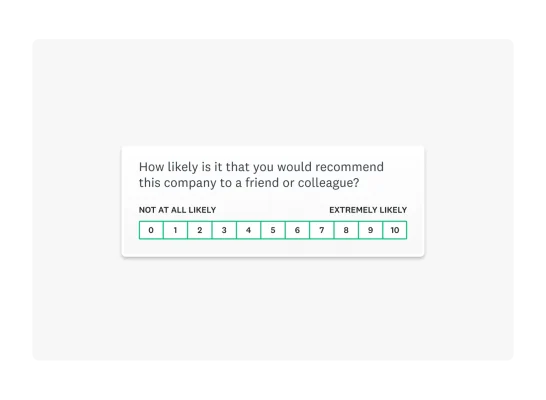
In a Net Promoter Score® (NPS) survey question, businesses aim to better understand customer loyalty. They achieve this through NPS surveys and by using a rating scale of 0-10.
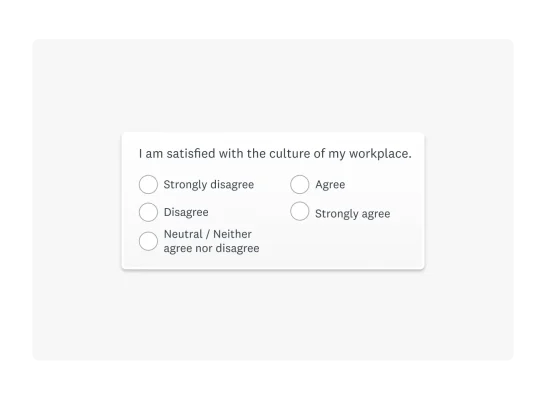
Another common rating scale is a worded one spanning from ‘Strongly agree’ to ‘Strongly disagree’ with a certain statement. Below, you can see this type of rating scale in action.
Numbered vs. worded rating scales
One of the core differences that sets rating scales apart is their use of numbers, words, or both. Using rating scales with different formats can allow people to express their opinions or ideas in distinct ways.
Some rating scales replace words with symbols to enhance their readability and make responding more intuitive. For example, instead of Strongly Agree/Disagree, researchers could replace these options with smiley faces representing enjoyment levels.
Numbered rating scales
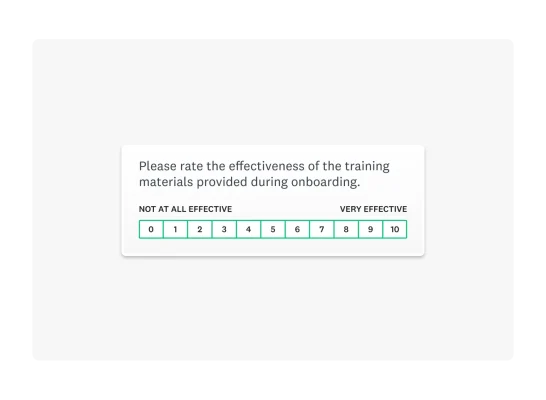
Numbered rating scales are a simple but effective way of collecting data from survey respondents. The exact numbers you use on a scale can vary, often ranging between 0-10, 1-5, or 1-100 in some cases.
A numbered rating scale is a popular option for many close-ended questions. You’ll find numbered scales in the vast majority of surveys.
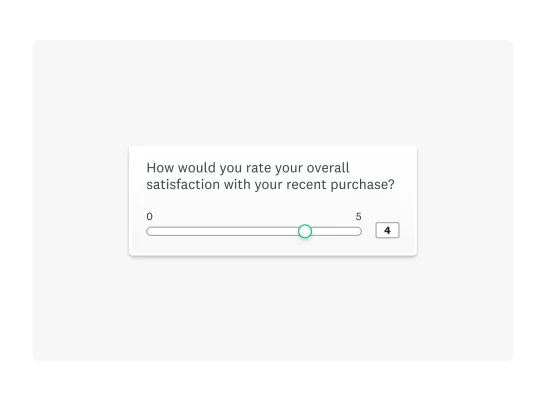
You can also make numbered rating scales interactive with slider rating scales. However, it’s important to note that this can create usability issues, especially on mobile.
Worded rating scales
Worded rating scales are ordinal scales that allow survey respondents to express their opinions using relative options.
While these question responses do use words, they are still inherently tied to numeric values. For example, the five options—Strongly agree to Strongly disagree—align with a 1-5 scale, simplifying numerical analysis.
Unipolar vs. bipolar rating scales
Unipolar and bipolar rating scales are two different formats for structuring worded rating scales.
A unipolar rating scale starts from zero and moves in a single direction. This form of rating scale would be useful when measuring the degree of someone’s interest, satisfaction, or frequency. For example, “How often do you use our services?” could use a unipolar rating scale of “Never” to “Every day.”
A bipolar rating scale, on the other hand, is when your rating scale has two extremes. Respondents will then select where they fall on the scale of completely one thing to completely another. Opposing variable questions, like “Strongly agree/Disagree” scales, are bipolar with two distinct ends.
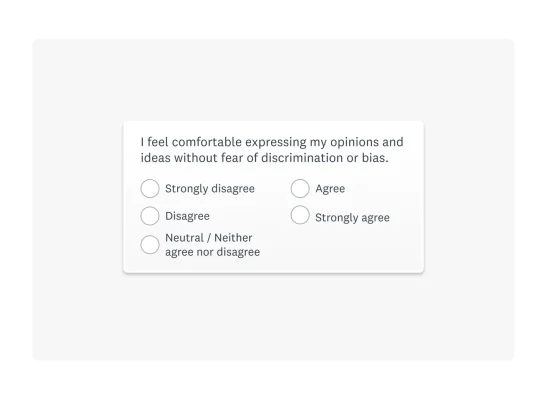
It's important to consider whether your rating scales should be unipolar or bipolar. This decision will help generate precise and useful data for analysis.
Related reading: 3 types of business-changing insights you can get from surveys
What is the Likert scale?
The Likert scale is a rating system that measures respondents’ opinions, thoughts, or emotional responses to a topic or statement. Typically, the Likert scale uses a 5 or 7-point ordinal scale.
The Likert scale can measure customer likelihood, satisfaction, and the importance they assign to a topic.
Another approach is the Guttman scale, where questions follow a cumulative pattern so that agreeing with harder items automatically implies agreement with easier ones. For instance, if someone can run a marathon, a Guttman scale assumes they can also run a 5K. Learn more about how to use Guttman scales in survey research to discover if this hierarchical approach fits your measurement needs.
Likert scale examples
The Likert scale is an extremely useful rating scale to measure customer opinions. For example, a company may use the Likert scale to determine the effectiveness of its customer support team. They offer respondents the opportunity to respond from “Extremely responsive” to “Not responsive at all.”
As the Likert scale produces structured data, it becomes easy to analyze and draw insights. In this example, the majority of customers only had an average experience with the customer service team. This can propel the company to make positive changes and iterations to enhance the customer experience.
Businesses can also use the Likert scale to measure friction in customer touchpoints. In the Customer Effort Score (CES) survey, businesses ask customers how easy it was to complete a certain action. The CES can determine the relative friction at each touchpoint, helping to identify areas where a company could improve.
Researchers who want to generate more precise data could expand this form of the Likert scale into a 7-point system. For example, answers could include:
- Strongly disagree
- Disagree
- Somewhat disagree
- Neither agree nor disagree
- Somewhat agree
- Agree
- Strongly agree
Related reading: What is the Thurstone Scale? Definition and examples
The pros and cons of different rating scales
To show which rating scales are best for certain situations, let’s discuss their pros and cons.
Strengths and weaknesses of a number scale
The number scale is a universally accepted form of survey measurement. With regards to a numbered scale question, the number selected will indicate the strength of the respondent’s opinion.
Here are the pros of a number scale:
- Simplicity: Almost all respondents are familiar with the standard number system and have previously seen a 1-10 rating scale.
- Ease of analysis: Each category label can represent the same value as its score. Since the label for each category reflects its score, there is no need to code information before crunching numbers.
- Precise: With a number list, a scale can be as long as the researcher likes without confusing any participants.
However, there are also several cons to using a number scale:
- Subjective: Depending on the person, a 5 on a scale from 1-10 could mean anything from good to barely a pass.
- Limited context: Just a number answer gives no additional context about why someone selected an answer.
- Intensity: As numbers do not have the same emotional connotation as written answers, responses may not capture someone’s feelings.
Strengths and weaknesses of a worded scale
Similar to the number scale, the word scale provides a list of scored categories for the respondent to select. However, instead of score values, a word scale uses descriptions for each category.
Here are the pros of a worded scale:
- Descriptive: Long-worded answers provide context to ensure a respondent picks an answer that closely aligns with their feelings.
- Verbatim responses: If 20% of respondents chose 5 on a 1-5 scale, the researcher couldn't interpret it in words. On the other hand, if 20% of people answered ‘Very Satisfied,’ the researcher can safely report that 20% of people in the study were very satisfied.
- Flexibility: With worded labels, the researcher can score and label categories however they feel without confusing the respondent.
While worded scales have several benefits, it’s important to also note the cons of this form of scale:
- Language: There is a potential difficulty for respondents who are not fluent in the language to understand.
- Lack of expression: The worded labels force respondents to fit into the researcher’s categories instead of expressing their opinions.
- Limited: More than seven responses on a word scale will result in confusion and overwhelm many respondents. This handicaps the level of precision achievable by a word scale as compared to a number scale.
What is better: a 5 or 10-point rating scale?
Both 5 and 10-point scales have several use cases where they shine. The best one for you in any scenario will depend on the goals of your survey.
A 5-point scale is ideal for easy responses, allowing respondents to fly through your survey. If you have lots of questions, a 5-point survey could increase your survey completion rates.
On the other hand, a 10-point scale provides a more nuanced spread of data. If you need to conduct a detailed analysis, the granular information that a 10-point scale offers would be more useful.
What is the 10-point rating scale best for?
A 10-point scale offers many benefits, making it a go-to option for many surveys.
Here are some of the advantages that a 10-point scale can provide:
- Familiarity: Everyone understands a 10-point scale and is used to ranking things in this way.
- Detail: 10-point scales offer twice as many response opportunities as 5-point scales. With that in mind, you can get a higher level of detail.
- Statistical analysis: Having more response options allows researchers to create more precise analyses, improving the quality of results.
Tips for using the best rating scales for surveys
Your rating scale depends on the survey, desired data, and target audience. Here are a few tips for getting the balance right.
Plan your survey design
Survey design is an often-overlooked part of making effective surveys. When planning a survey, the rating scales you select should fit your considerations. Think of the data you want to generate, then tailor your rating scale to fit that data.
If you select a certain type of rating scale, ensure you plan to avoid any potential downsides. For example, a numerical scale is great for analysis, but numerical values could be subjective in a survey. To get around this, you can plan to explain what the numbers mean.
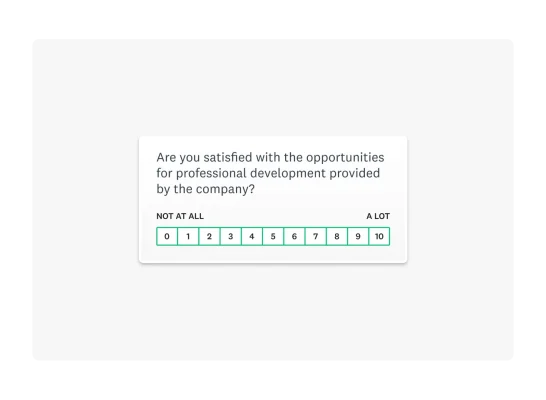
In the survey above, 0 means “Not at all” while 10 means “A lot.” Including these small, quantifiable factors in your survey design planning can make a big difference and help overcome any cons of certain rating scales.
Choose a rating scale that makes sense for your audience
When you plan a survey, you should think about the audience that will take it. Based on your customers or wider audience, the right rating scale for you may change.
For example, you could introduce slider and star rating questions to make your surveys quicker and easier to fill in. These would be perfect for a busy audience that doesn’t have enough time to respond to a lengthy survey.
Alternatively, if you’re writing a survey for a research group that is prepared to spend time on your survey, then you can opt for larger worded scales with lots of opinions.
Knowing your audience and adapting your survey for them is a great way to set the survey up for success.
Writing good survey questions
No matter what scale you opt for, it’s important to remember leading survey writing practices to get the best data possible. Low-quality questions will lead to low-quality responses, confusing your data and devaluing the insights you produce.
Here are a few considerations to take into account when writing your survey questions:
- Avoid leading and loaded questions.
- Begin with screening questions to save time and improve response quality.
- Use rating scales over simple agree/disagree styles.
- Avoid bias and write clearly.
Creating good survey questions is especially important when using rating scales, as you need to set your respondents up with enough context to effectively respond to your questions.
Using rating scales to enhance survey response quality with SurveyMonkey
Rating scales are more than just a way to collect data—they're a strong way to gain context into your audience's true thoughts and feelings. When used effectively, they can provide invaluable insights that drive business decisions, improve customer satisfaction, and fuel growth.
But creating the perfect survey isn't just about choosing between numbers and words. It's about crafting an experience that resonates with your audience and yields meaningful results. This is where SurveyMonkey shines.
Create better surveys today with SurveyMonkey.
Discover more resources

Toolkits directory
Discover our toolkits, designed to help you leverage feedback in your role or industry.

Survey with file upload: How-to, examples, and tips
Forms gather vital info, but sometimes you need to conduct a survey with a file upload option. Here’s how to create a survey with file upload.

How to find survey respondents in 5 steps (with examples)
Get the best data from your survey. Learn how to find survey respondents people with these tools and tips from our survey research experts.
