Tips for increasing survey completion rates
Survey respondents are precious. As a survey creator, your hope is that everyone who starts your survey will, well, finish it. And for good reason—a survey with a low completion rate may leave you wondering whether the people who bailed out along the way have left you with biased results. To learn how to maximize the number of people who complete surveys and get you the data you need to make good decisions, we dug into a trove of anonymized data from more than 25,000 surveys conducted on SurveyMonkey Audience, our proprietary market research panel. Each of these surveys had at least 100 respondents.
We presented this work at the American Association of Public Opinion Research Annual Conference (AAPOR) to our survey research peers and we’re excited to now share these findings with you, dear blog readers!
Do keep it simple
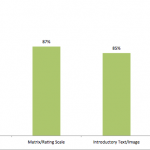
As with any conversation, you should start with a friendly, easy to answer question. Surveys that opened with a simple, multiple-choice question had an 89% completion rate on average. By comparison, surveys that began with an open-ended question (comment box) had a significantly lower completion rate at 83%. So on average, you’ll lose another six people out of every 100 just because the opening question seemed to be too much work.

If you have to ask an open-ended question (don’t worry, there are good reasons to do it), don’t ask it in the beginning—allow your survey taker to get into a rhythm answering easier questions. Even when we limited our analysis to surveys containing a single open-ended question, surveys where the open-end was at the beginning had a lower completion rate than those where the question was asked later in the survey.
Don’t get greedy—ask only what you need to know
When you send someone a survey, you’re asking for their time. Unsurprisingly, longer surveys have lower completion rates because the demands on the survey taker’s time go up.

The chances of someone completing your survey is directly and linearly related to the number of questions. While a 10 question survey has an 89% completion rate on average, 20 question surveys are slightly lower at 87%, followed by 30 question surveys at 85%. Now when a survey has 40 questions, the completion rate is 79%. That’s a whopping 10 percentage points lower than the completion rate for 10 question surveys.
The takeaway here: be mindful of your respondent’s time. In order to get the most of out of your survey, think about your survey goals before writing questions. Once you have goals in mind, write questions that help address those goals and don’t ask for more information than you need.
Don’t ask multiple hard-to-answer questions
There are times when a survey’s goals can’t be met without asking a matrix question, a rating scale or ranking question, or even including a text box. And for the most part, that’s okay—the difference between asking 1 or 0 of these questions only lowers completion by 1% or less.

But don’t ask too many of these “hard” questions because the completion rates sink quickly as the number of matrix or rating scale and open-ended questions increases. Surveys with 10 matrix or rating scale questions have only an 81% completion rate while surveys with 1 matrix/rating scale question average a completion rate of 88%.
As the chart above shows, the dropoff is even more severe for open-ended questions. Surveys with 10 open-ended questions have a mean completion rate that is more than 10 percentage points lower than those with 1 open-ended question (88% vs. 78%).
Don’t use many words when a few will do
When we constructed a model to discover the survey attributes that best predict completion rates, the number of words in the question text jumped out. We discovered that each additional word in the question text has a negative effect on completion rates.
Also, even after accounting for the number of words in the entire survey, the number of words in the first question text is a significant predictor of lower completion rates. So if you have a question with a lot of text, don’t ask it in the beginning.
However, here are circumstances in which using more words helps clarity. For example, “Are you going to buy a wearable?” isn’t nearly as easy to answer as, “How likely are you to purchase a wearable technology device like Google Glass or a Fitbit?” Indeed, don’t over-correct for length by sacrificing the clarity of the question.
So let’s wrap this up for you, dear readers. Follow the Don’ts above and Do:
- Start with a simple, easy-to-answer question
- Ask only the questions for which you need answers
- Limit the number of open-ended questions and other hard-to-answer questions
- Ask short but clear questions
Discover more resources

Toolkits directory
Discover our toolkits, designed to help you leverage feedback in your role or industry.

Future of surveys: What our platform says about 2025
New proprietary data on survey trends, the growth in mobile surveys and why it signals new habits, new users, and better ways of collecting data.

Survey with file upload: How-to, examples, and tips
Forms gather vital info, but sometimes you need to conduct a survey with a file upload option. Here’s how to create a survey with file upload.

How to find survey respondents in 5 steps (with examples)
Get the best data from your survey. Learn how to find survey respondents people with these tools and tips from our survey research experts.