Results Dashboard
Easily create and share dynamic survey dashboards with real-time results.

Show the story in your data
Transform your survey results into a report your stakeholders will understand. With survey dashboards, you can highlight key takeaways and even add in your own notes or recommended next steps. You can create multiple dashboards for any single survey. Plus, your dashboards dynamically stay up-to-date and can be shared with anyone via a weblink.
Focus in on key insights
By creating survey dashboards, you can easily surface the most important details for specific groups. Help your stakeholders see where and how to take action on your survey results.
Customize your dashboard
Whether it’s for your boss, colleagues, or clients, easily personalize how you share results. Filter answer data, select which questions to show, drag-and-drop charts, and customize your layout.
Save everyone time
Show your stakeholders only the information they want or need to see. Data will dynamically refresh as new results come in, so you don’t need to spend time updating static reports and presentations.

Take action on key metrics
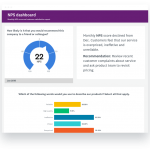
Want to monitor your Net Promoter Score®, identify its key drivers, and easily keep everyone informed along the way?
With Results Dashboards, you can:
- Filter data by month or week, and then show charts side-by-side to easily compare scores over time
- Add comments below or next to individual charts to flag changes or provide more context
- Display what delights your customers and what drives their dissatisfaction
- Customize charts and colors to personalize your dashboards
- Share your recommendations—all backed up by data—with executives, managers, or even your own team
Ready to make your own dashboard?
Give people the data they need
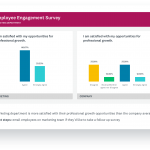
Only want to share some key findings with specific groups? Here’s how you could run a quarterly employee engagement survey across an organization and give each team actionable insights.
With Results Dashboards, you can:
- Filter data by department, team, or business unit, and create individual dashboards for any group
- Show stakeholders key points by including data on things like key attributes, such as job satisfaction
- Tailor the look and feel of your dashboards with custom colors
- Show how teams or departments compare to overall averages
- Do a side-by-side comparison of results from different time periods to see trends and changes

Ready to build your own dashboards?
Discover more resources

Toolkits directory
Discover our toolkits, designed to help you leverage feedback in your role or industry.

Future of surveys: What our platform says about 2025
New proprietary data on survey trends, the growth in mobile surveys and why it signals new habits, new users, and better ways of collecting data.

Survey with file upload: How-to, examples, and tips
Forms gather vital info, but sometimes you need to conduct a survey with a file upload option. Here’s how to create a survey with file upload.

How to find survey respondents in 5 steps (with examples)
Get the best data from your survey. Learn how to find survey respondents people with these tools and tips from our survey research experts.

